The Ketchup Conundrum: An ancient question and a noble quest
Tale as old as time
For years and years the mystery has persisted and haunted the Danish population, what brand of ketchup is really the best between the Danish Beauvais and the American Heinz? This spicy question has been tainted with so many personal feelings and emotions, that the search for the answer by means of debate and reason has long since been forsaken and made impossible. Now, only myths that can be considered nothing but scents and hints of the truth, remain.

“[Insert any ketchup label here] is just the best, there is no question!”
“Jutland favors Beauvais and Copenhagen favors Heinz…”
“It is easy to taste the difference between Beauvais and Heinz!”
The list goes on. Everybody talks, but really, no one knows. It was at this point that we embarked on a quest to answer this most essential and holy question, but not based on personal sentiments and anecdotal pseudo-evidence. No, based on actual data.
For those who have not heard of it before, data collection is this concept, where quantitative information about a phenomenon is gathered in order to learn about its dynamics, when we can not yet give a complete account of such a system’s properties. When we are too simple minded to fully comprehend the structure of a system, we turn to the data in search of valid and unbiased inference. Data analysis and statistics are the lenses that we use to straighten out the multitude of intertwined fibres and fabrics of space and time into something that does not make us go (too) dizzy.


Having justified the existence of data analysis and my reason to live (at least during working hours), let’s turn back to the question at hand. How do we get our hands on such exotic data? For this we need to go back to the beginning.
Would you like to taste some ketchup?
Talk began at the Section of Biostatistics University of Copenhagen about the upcoming Culture Night taking place in Copenhagen. The Faculty of Health Sciences, University of Copenhagen, was looking for proposals for minilabs to set up at Panum for the Culture Night participants to visit. One day, Anne Helby Petersen barged into my office. Frantically and almost out of breath, she uttered the words, we should come up with a statistical proposal, shouldn’t we? She was right. The Culture Night is an opportunity to let the public engage with science, and statistics should not miss out on the party. At a loss of any reason not to participate, I merely responded to the calling, sure!
Soon after, Anne had found us two more partners in crime, Mark Bech Knudsen and Ann-Sophie Buchardt. With an average age of only 29, this quartet was a true force to be reckoned with. We were all in agreement that we would like to illustrate the twists and turns of on-site data collection and illustration. But how do you get people excited about that? Just then, it was as the sun appeared from behind the sea of clouds engulfing Copenhagen on that day, and the sudden flow of light enchanted the room.

There has to be something to eat. Like a blind-tasting! Anne said. We were uplifted. The idea was that if we wanted to attract the visitors on the Culture Night, we should offer them what they could not resist. The answer was clear. Ketchup, everyone knows of ketchup! And what scientific question could we find that is associated with ketchup? It was all too obvious. We should give it our all to settle the unending debate of… (Say it with me)… Beauvais or Heinz?
So we went and bought 8 litres of each type of ketchup and some bread which we cut into small pieces. Mark put together an app where the participants could answer a series of questions about themselves along with which ketchup they preferred, A or B. The Culture Night staff provided us with screens for showing the live updated data, and we four made sure that we were energized and ready to discuss data with all of our coming guests. We were even given a prime spot, right by the coffee shop and just across the bar.

The ketchup effect
The clock turned six. No guests yet. The clock turned six’o’one. No guests yet. The clock turned six’o’two. The first guests started arriving! Suddenty they were tasting the ketchups, they were baffled by what turned out to be their favorite flavor, and they were discussing the silly relationships between what was one’s favorite ketchup and one’s shoe size or number of siblings, showing on the screens. One guest even spoke the three words that we all so long to hear. “I love data!”

So the hours passed and the night was soon ending. Even though the assumption of independence between our research subjects was most likely violated to some extent, and there might have been some selection going on in who actually wanted to have a taste, we were kept busy discussing data and explaining figures for almost the full five hours of the event. There was no time to go to the bar only a few metres away. And just for one night, we were statisticians in the wild, who had taken to the streets with a modest but stern and irrepressible revolution in the name of spreading data science beyond the borders of our enclosed offices. With only 7 litres of each label of ketchup left (it turns out that you don’t need that much ketchup for a blind-tasting), we turned home.


But what about the question?
At the beginning I teased that we would try to figure out which ketchup is actually preferred when personal attachments have been removed. Now you know how we obtained the data material that we will use to try and answer this question. Let’s take a look at the data on the 260 subjects who provided us with answers to the survey. Of these 260 subjects, 248 provided us with complete data. Apart from favorite ketchup between the two anonymized labels, the questions concerned age, shoe size, locality (place of upbringing), bedtime (on a typical Friday night), pet (favorite kind of pet), meat (do you eat meat?), sport (favorite sport), siblings (number of siblings), and ketchup-liking (on a scale from 1 (least) to 5 (most), how much do you like ketchup?). These questions were constructed to be in-offensive, and to let us address important side questions such as, “do Jutlanders have a higher probability of favoring Beavais than Sealanders do? Our sample is seen to be quite young, be mostly from Sealand, mostly preferring dogs as pets, and mostly favoring a different sport to football and handball. We list some population characteristics below.
There were 248 participants with complete data.
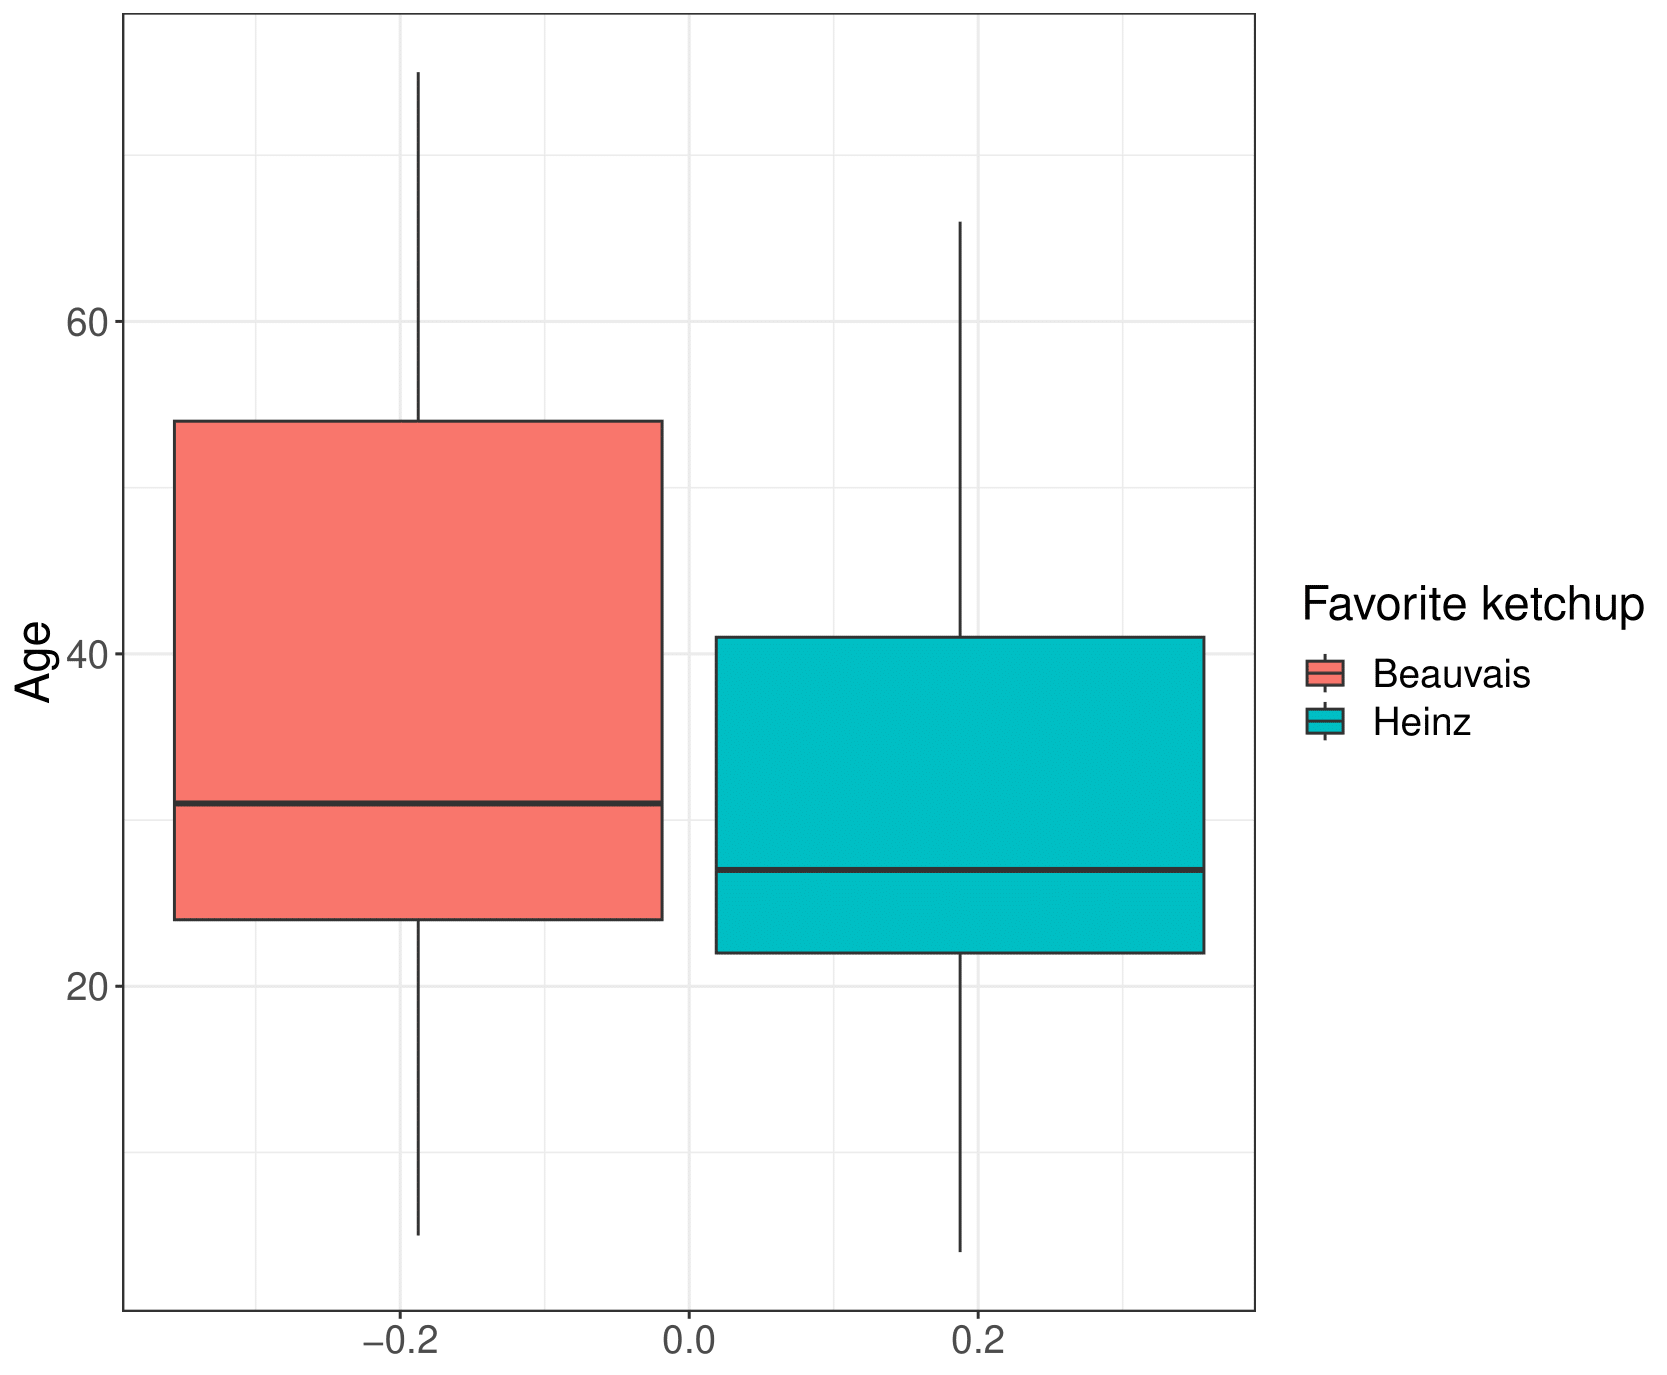
The participants had a median age of 28 with an interquartile range of 23 to 45.2.
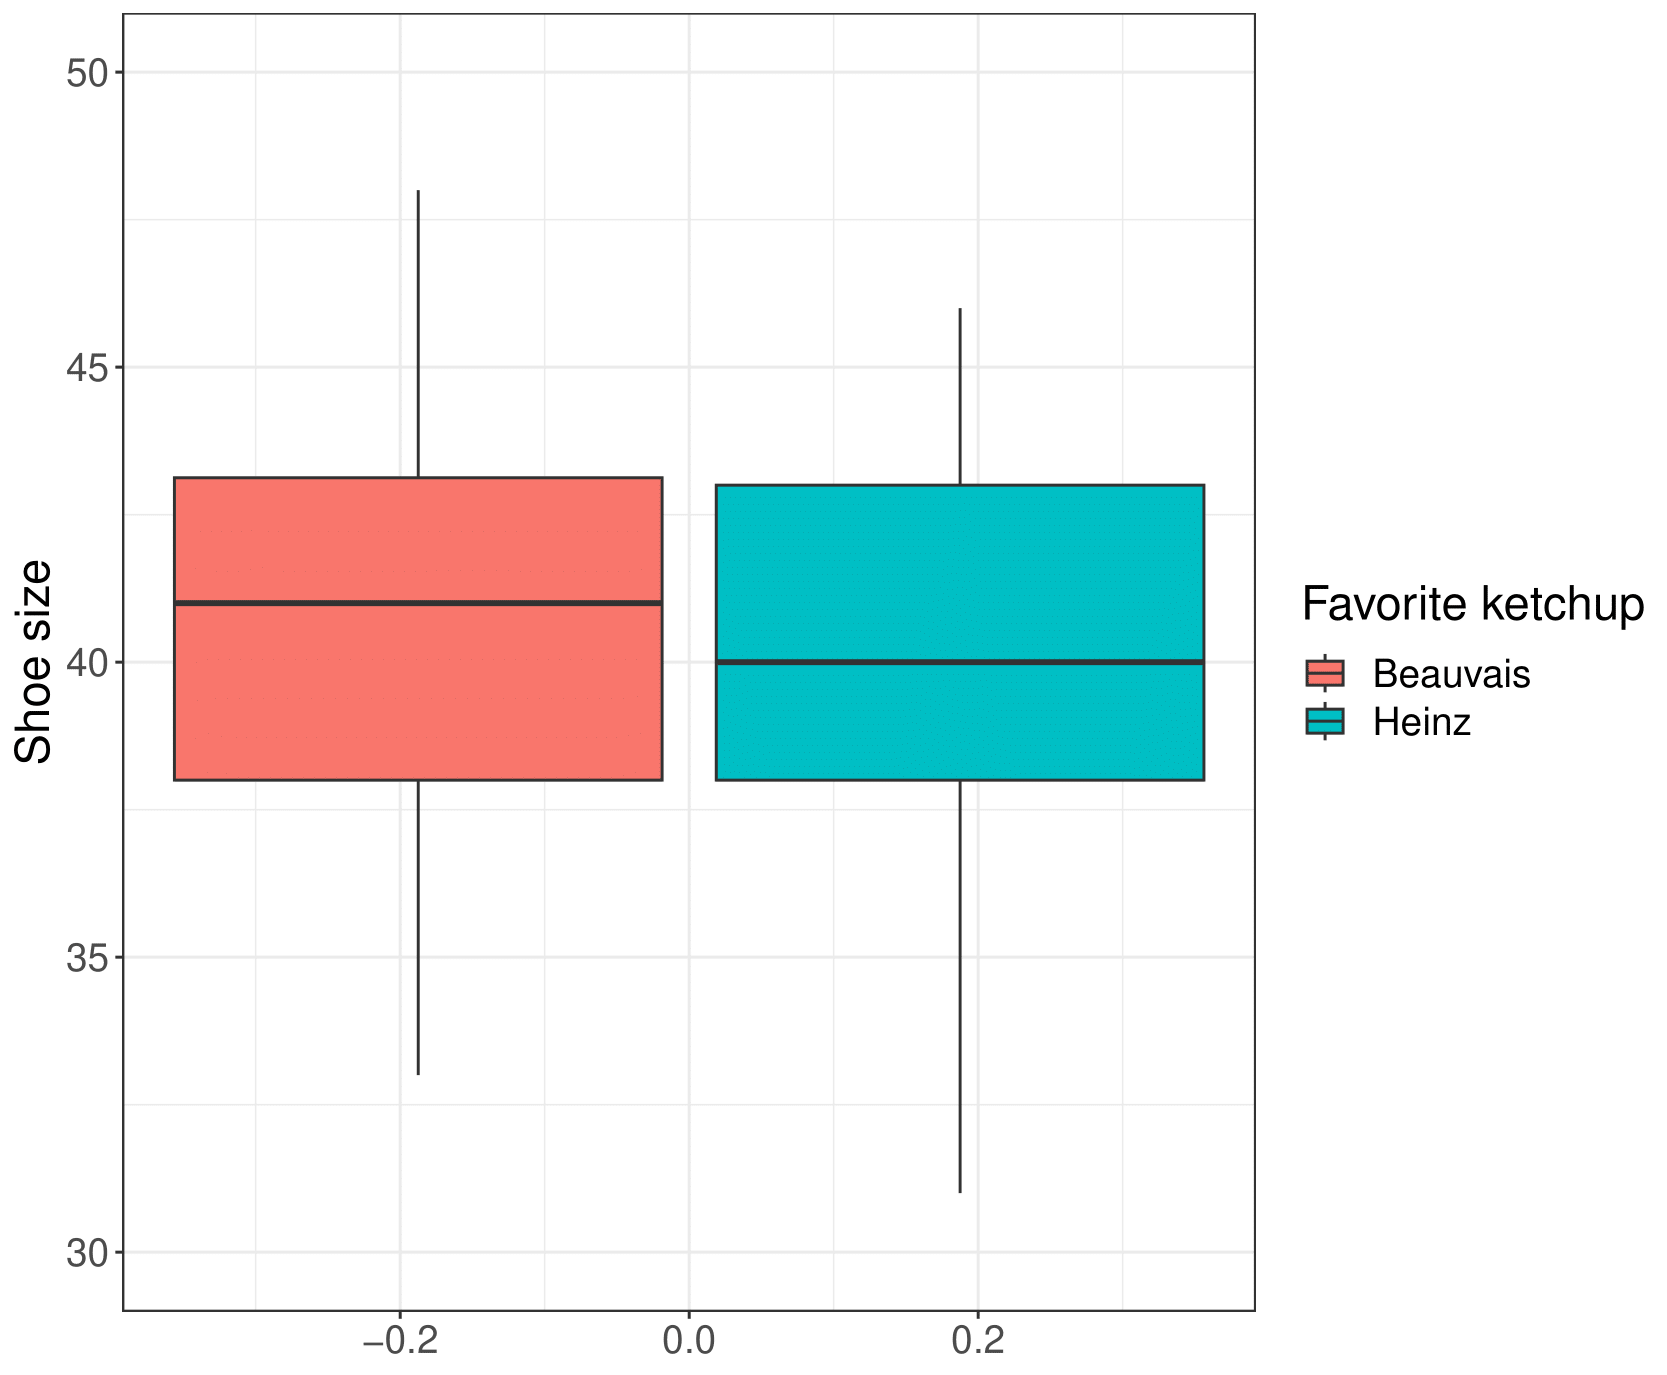
The participants had a median shoe size of 40 with an interquartile range of 38 to 43.
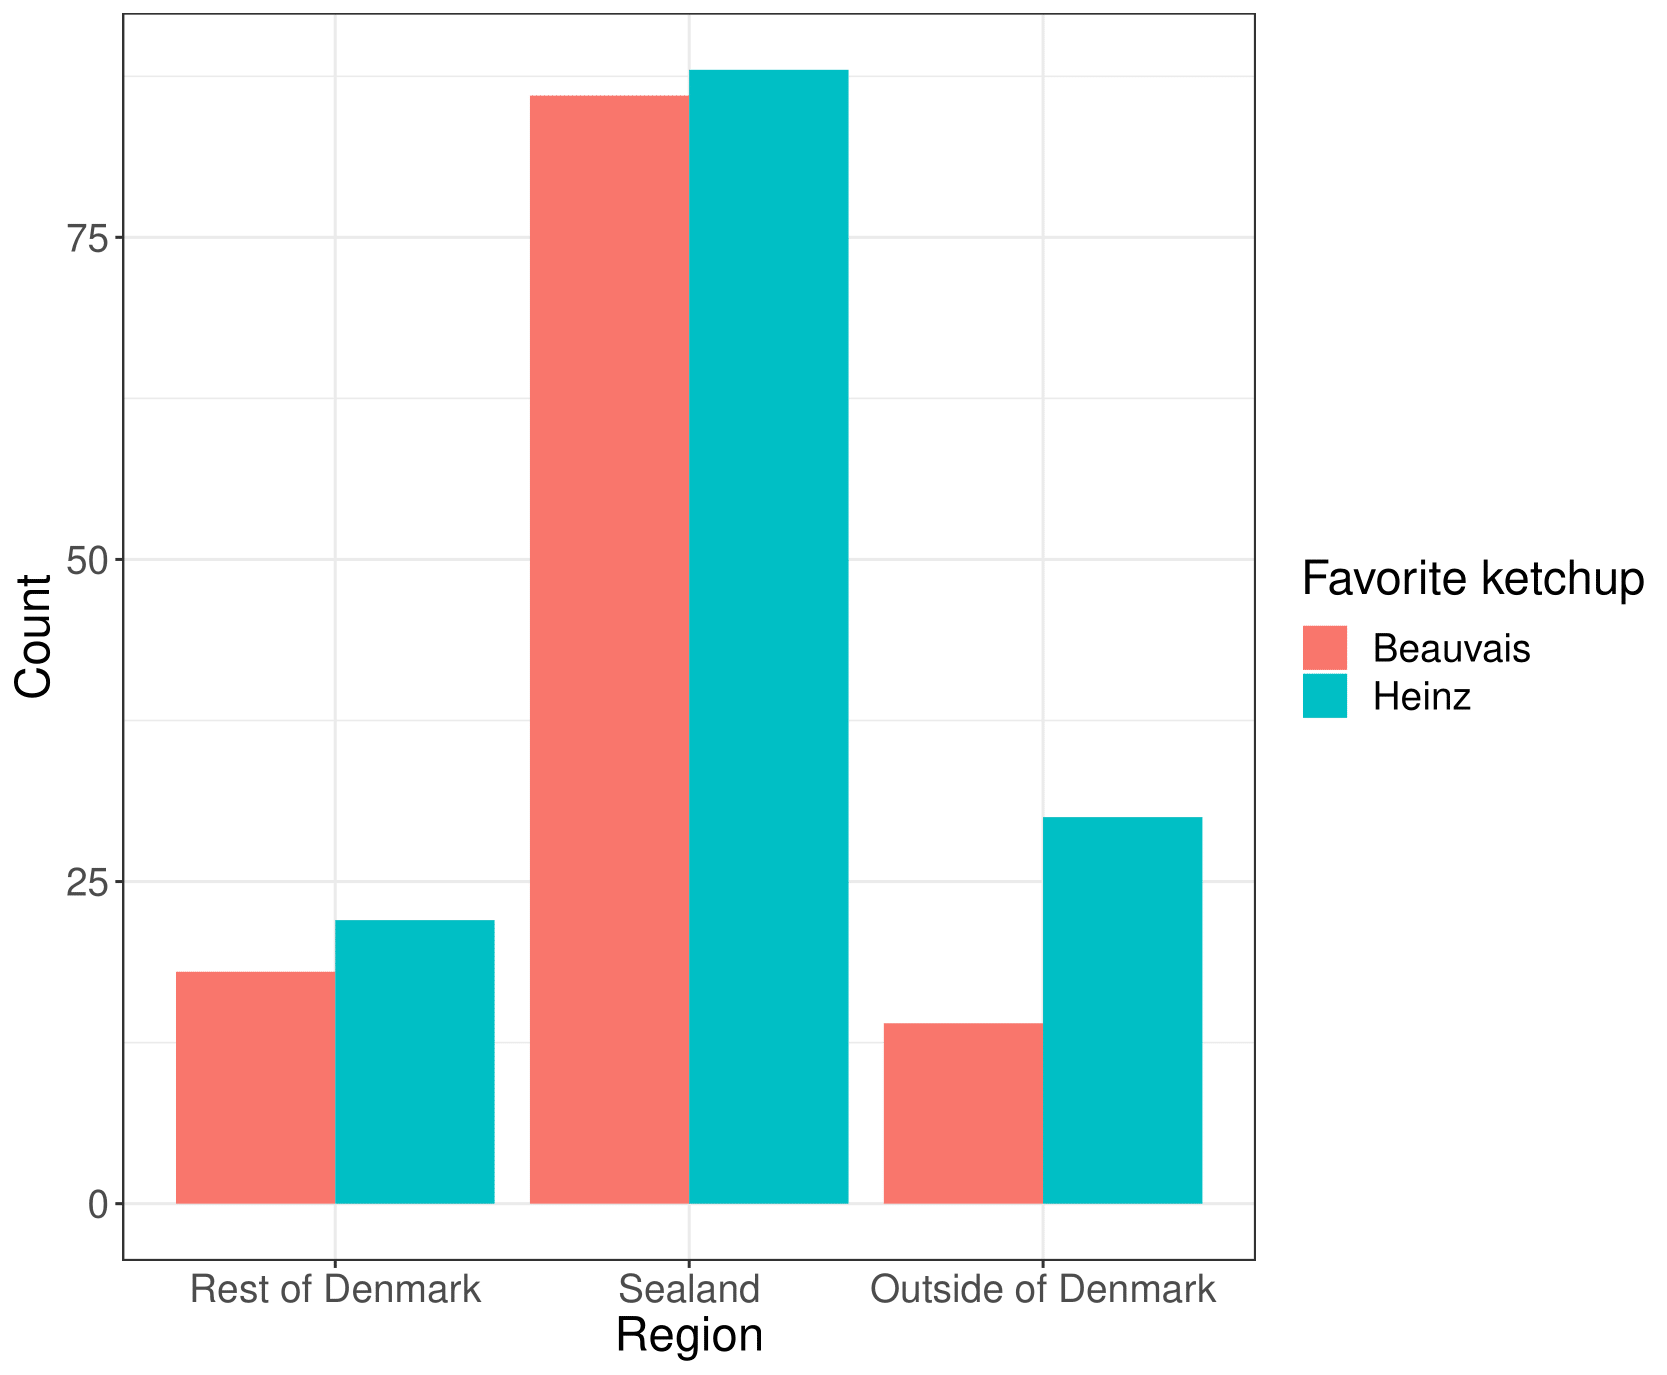
\(66.9 \%\) of the participants grew up on Sealand, while 16.1 \(\%\) grew up in Denmark outside of Sealand, and \(16.9 \%\) grew up outside of Denmark.
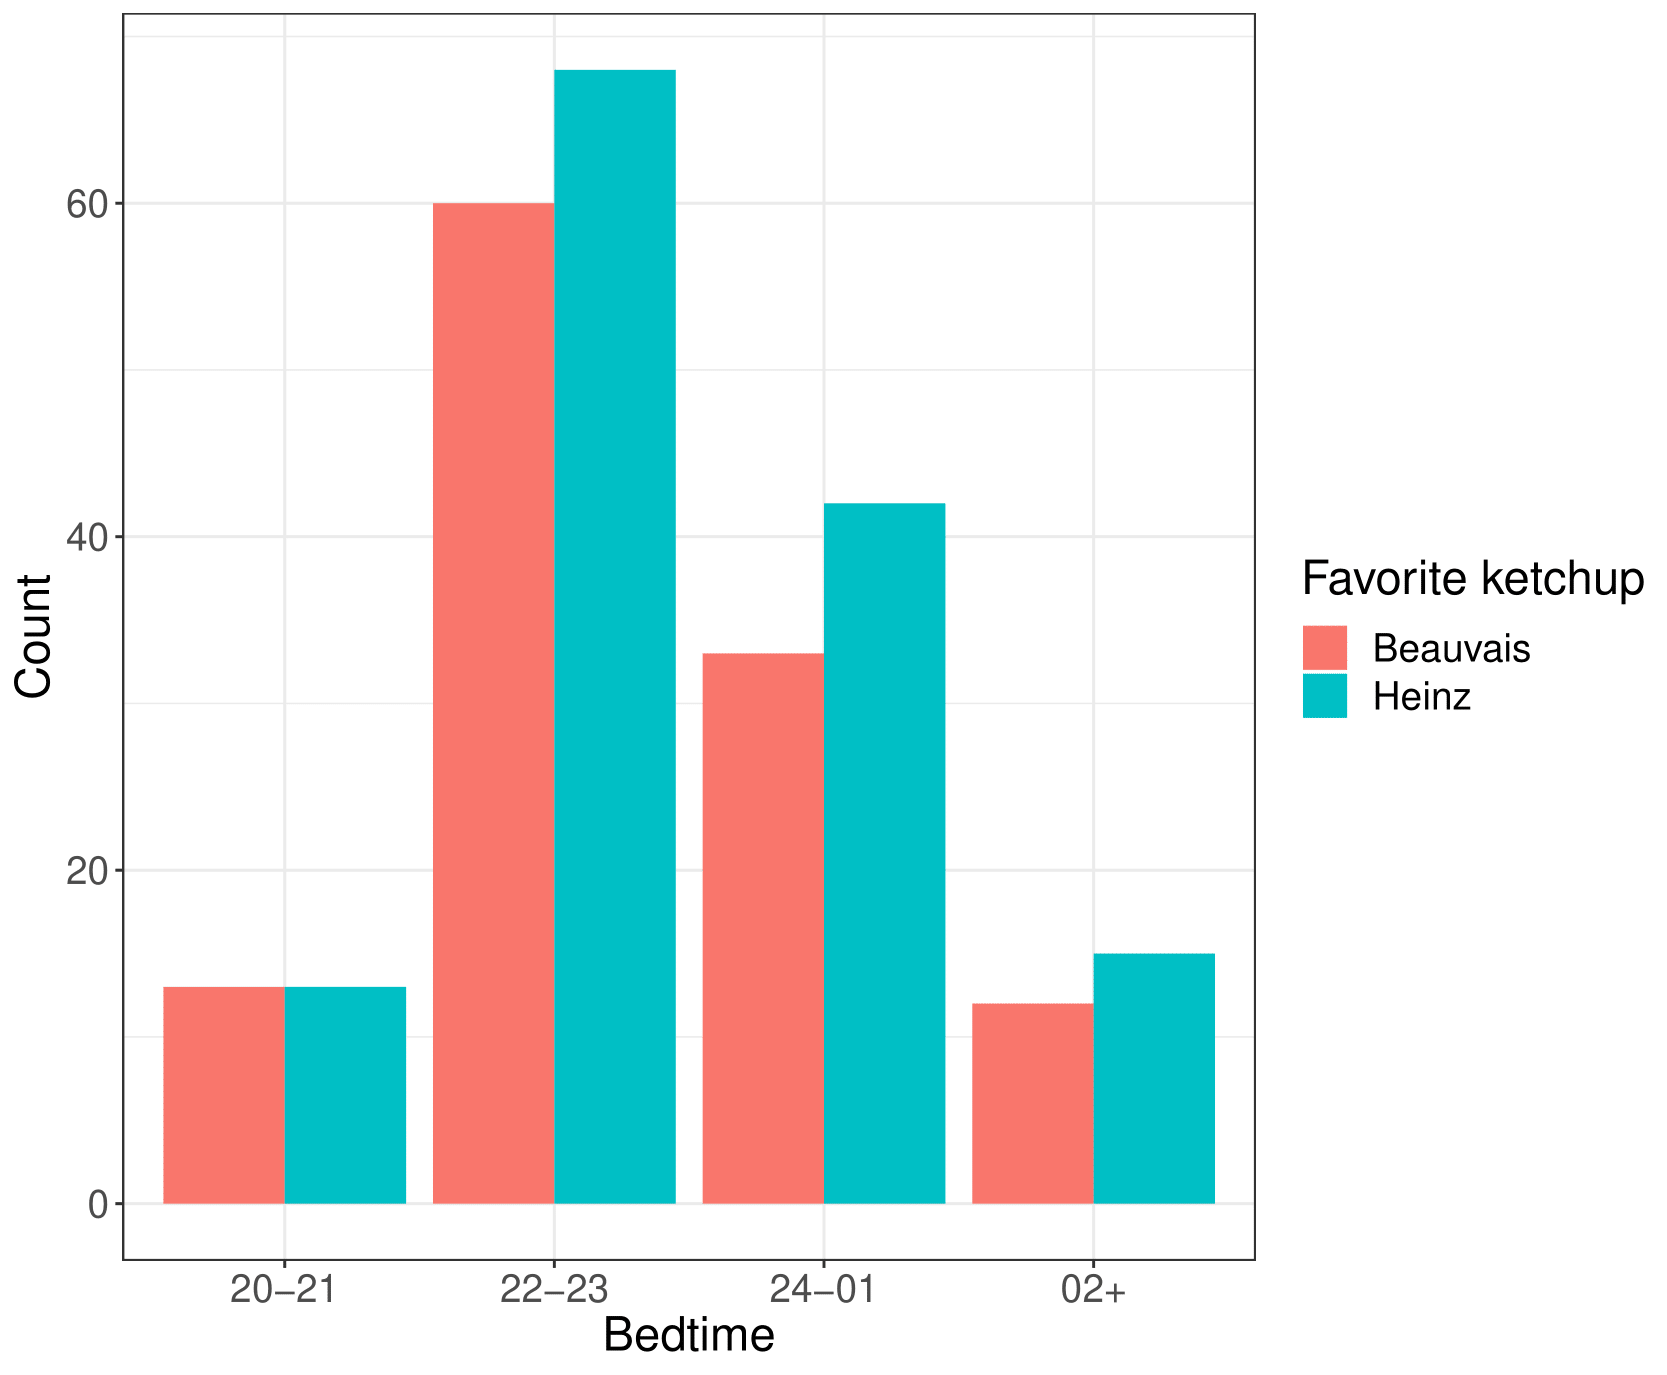
\(10.1 \%\) would go to bed before 22:00 on a regular friday night, \(50.0 \%\) between 22:00 and 23:59, \(29.0 \%\) between 00:00 and 01:59, and \(10.9\%\) at or after 02:00.
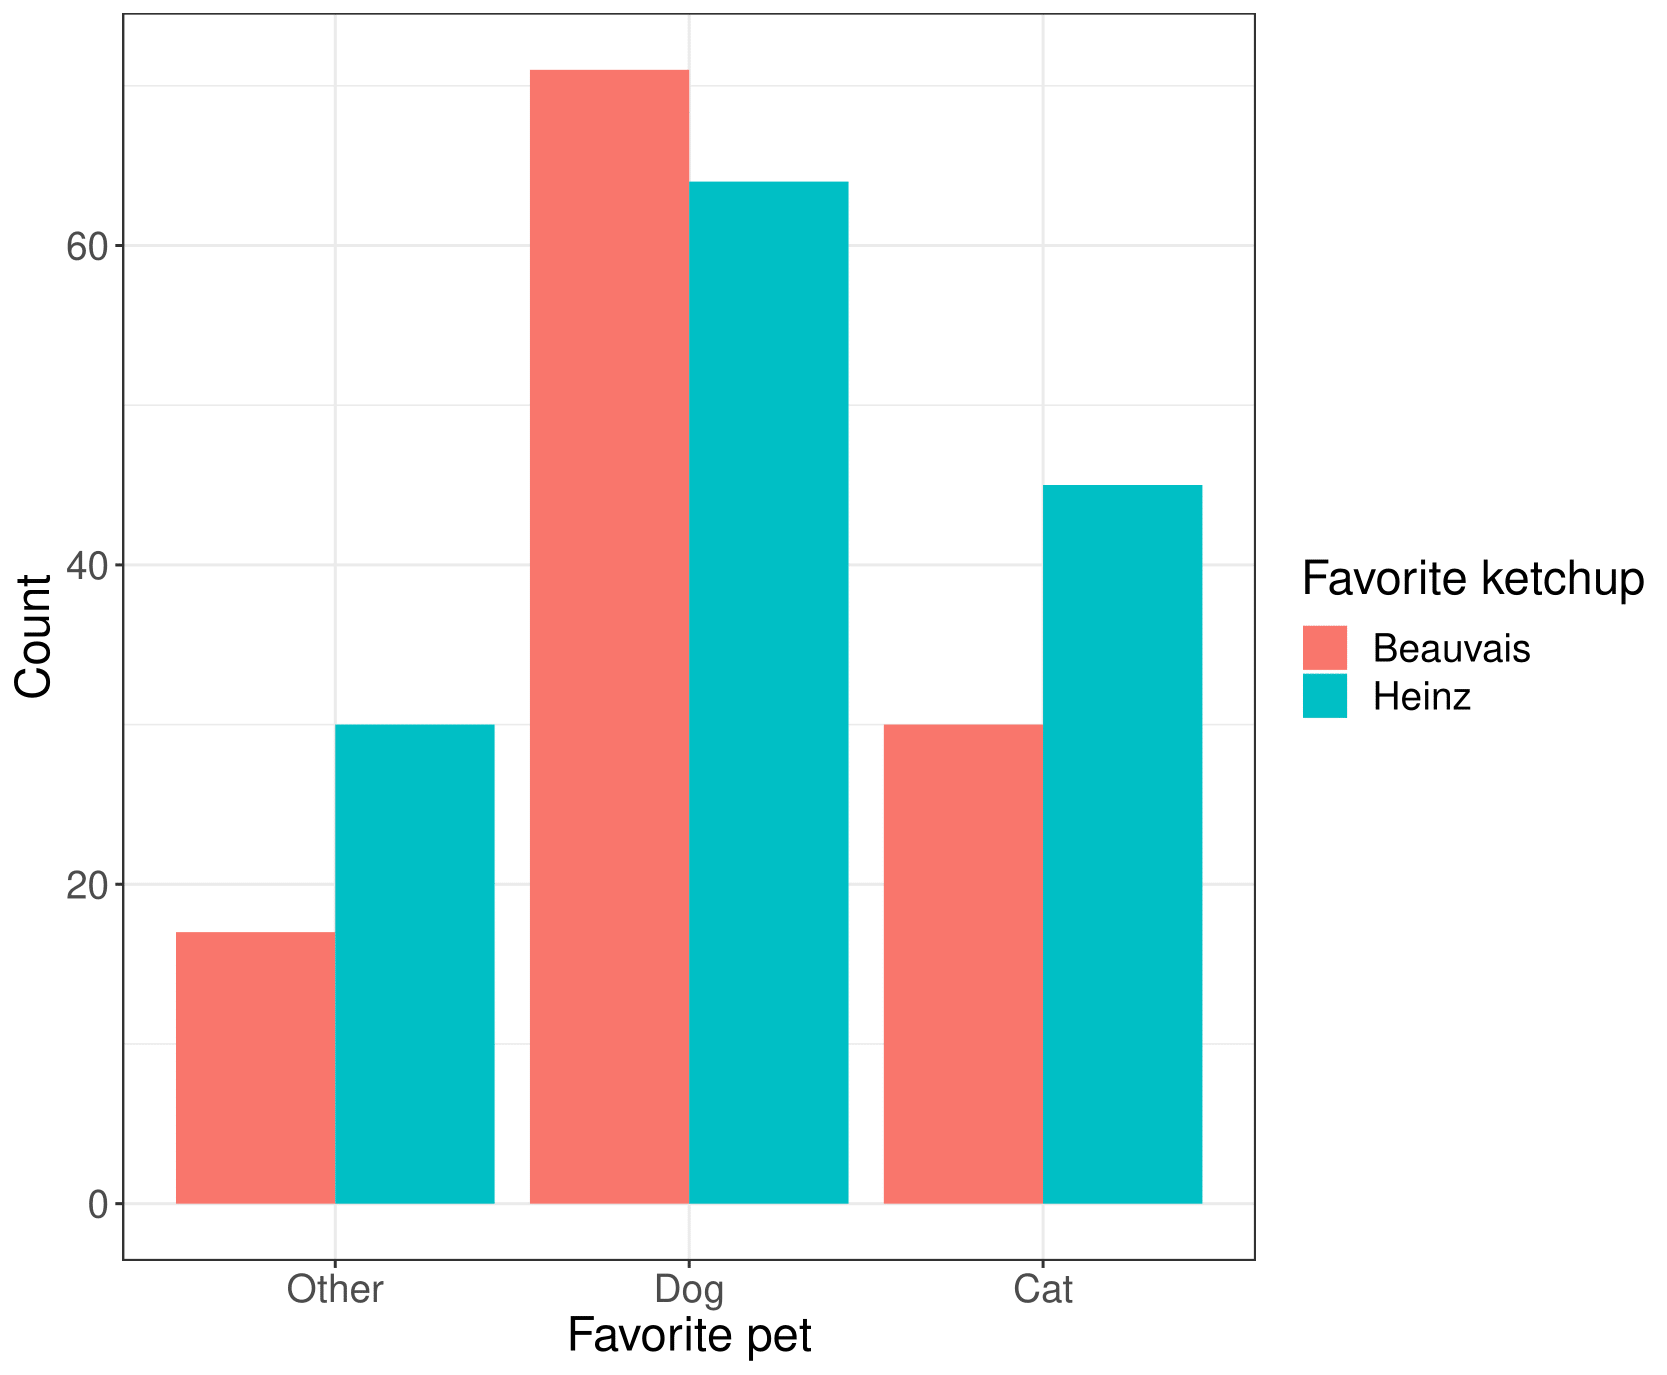
\(52.8 \%\) preferred Dogs, \(28.6 \%\) cats, and \(18.5\%\) other kinds of pets.
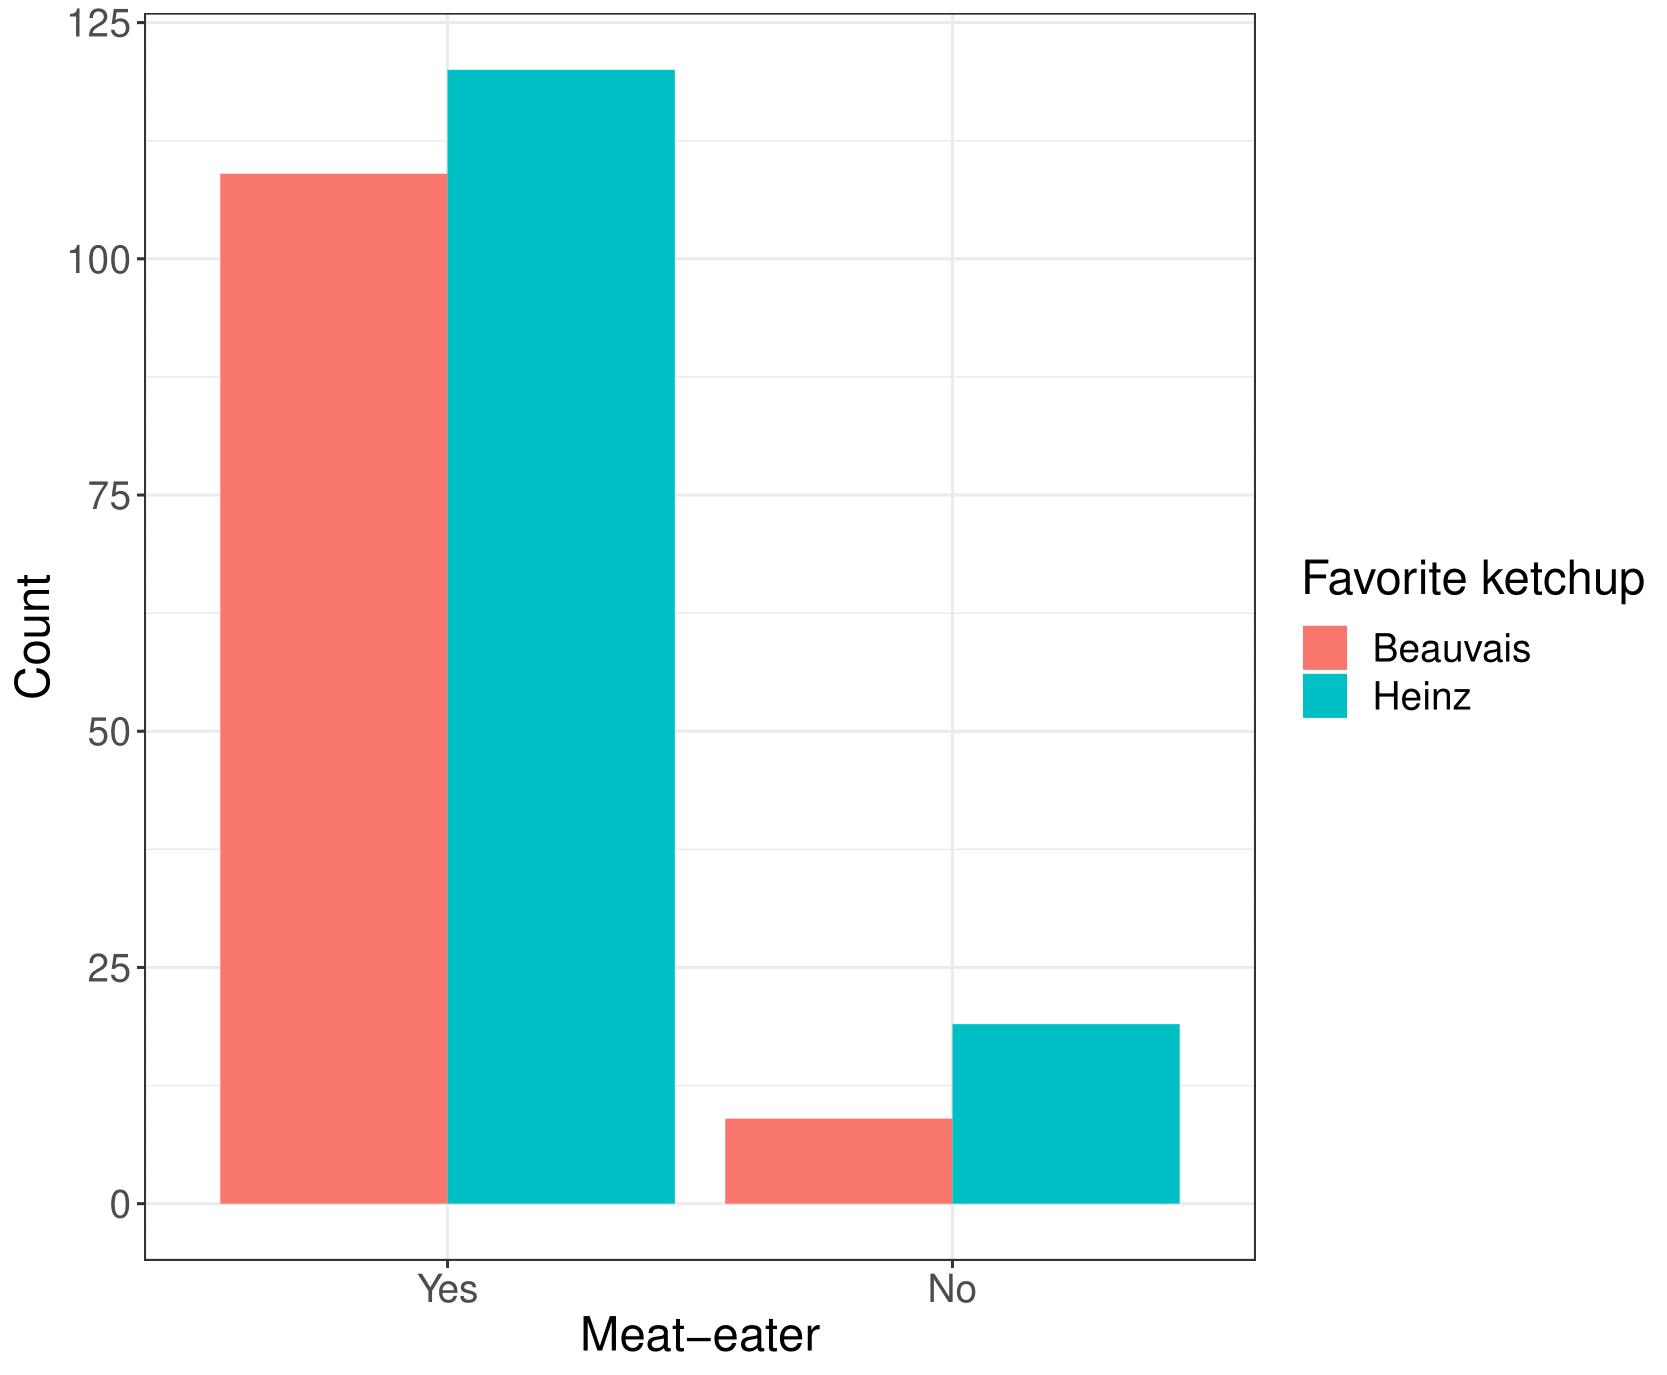
\(88.7 \%\) ate meat and \(11.3\%\) did not.
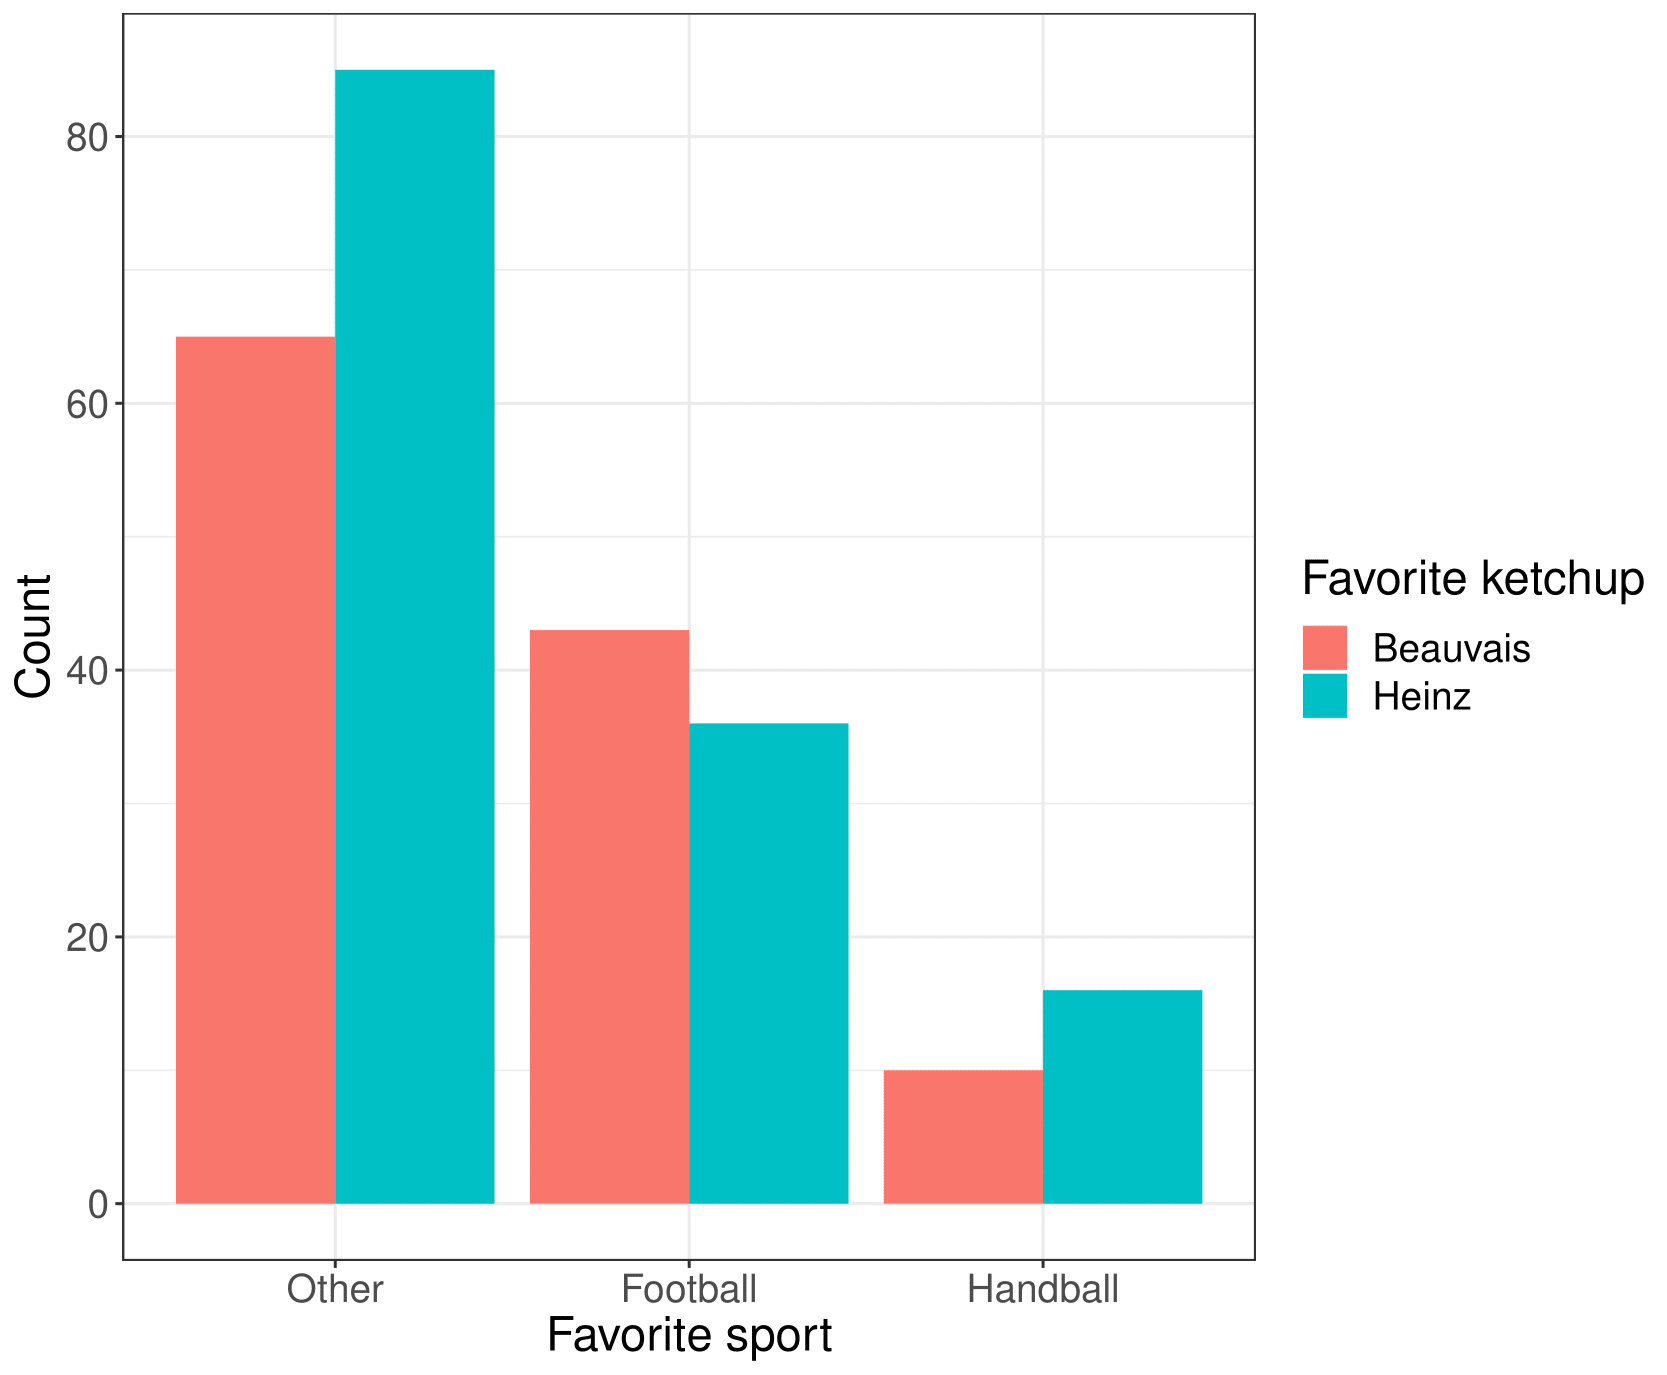
\(31.5\%\) preferred football as a sport, \(10.0\%\) preferred handball, and \(58.5\%\) preferred something else.
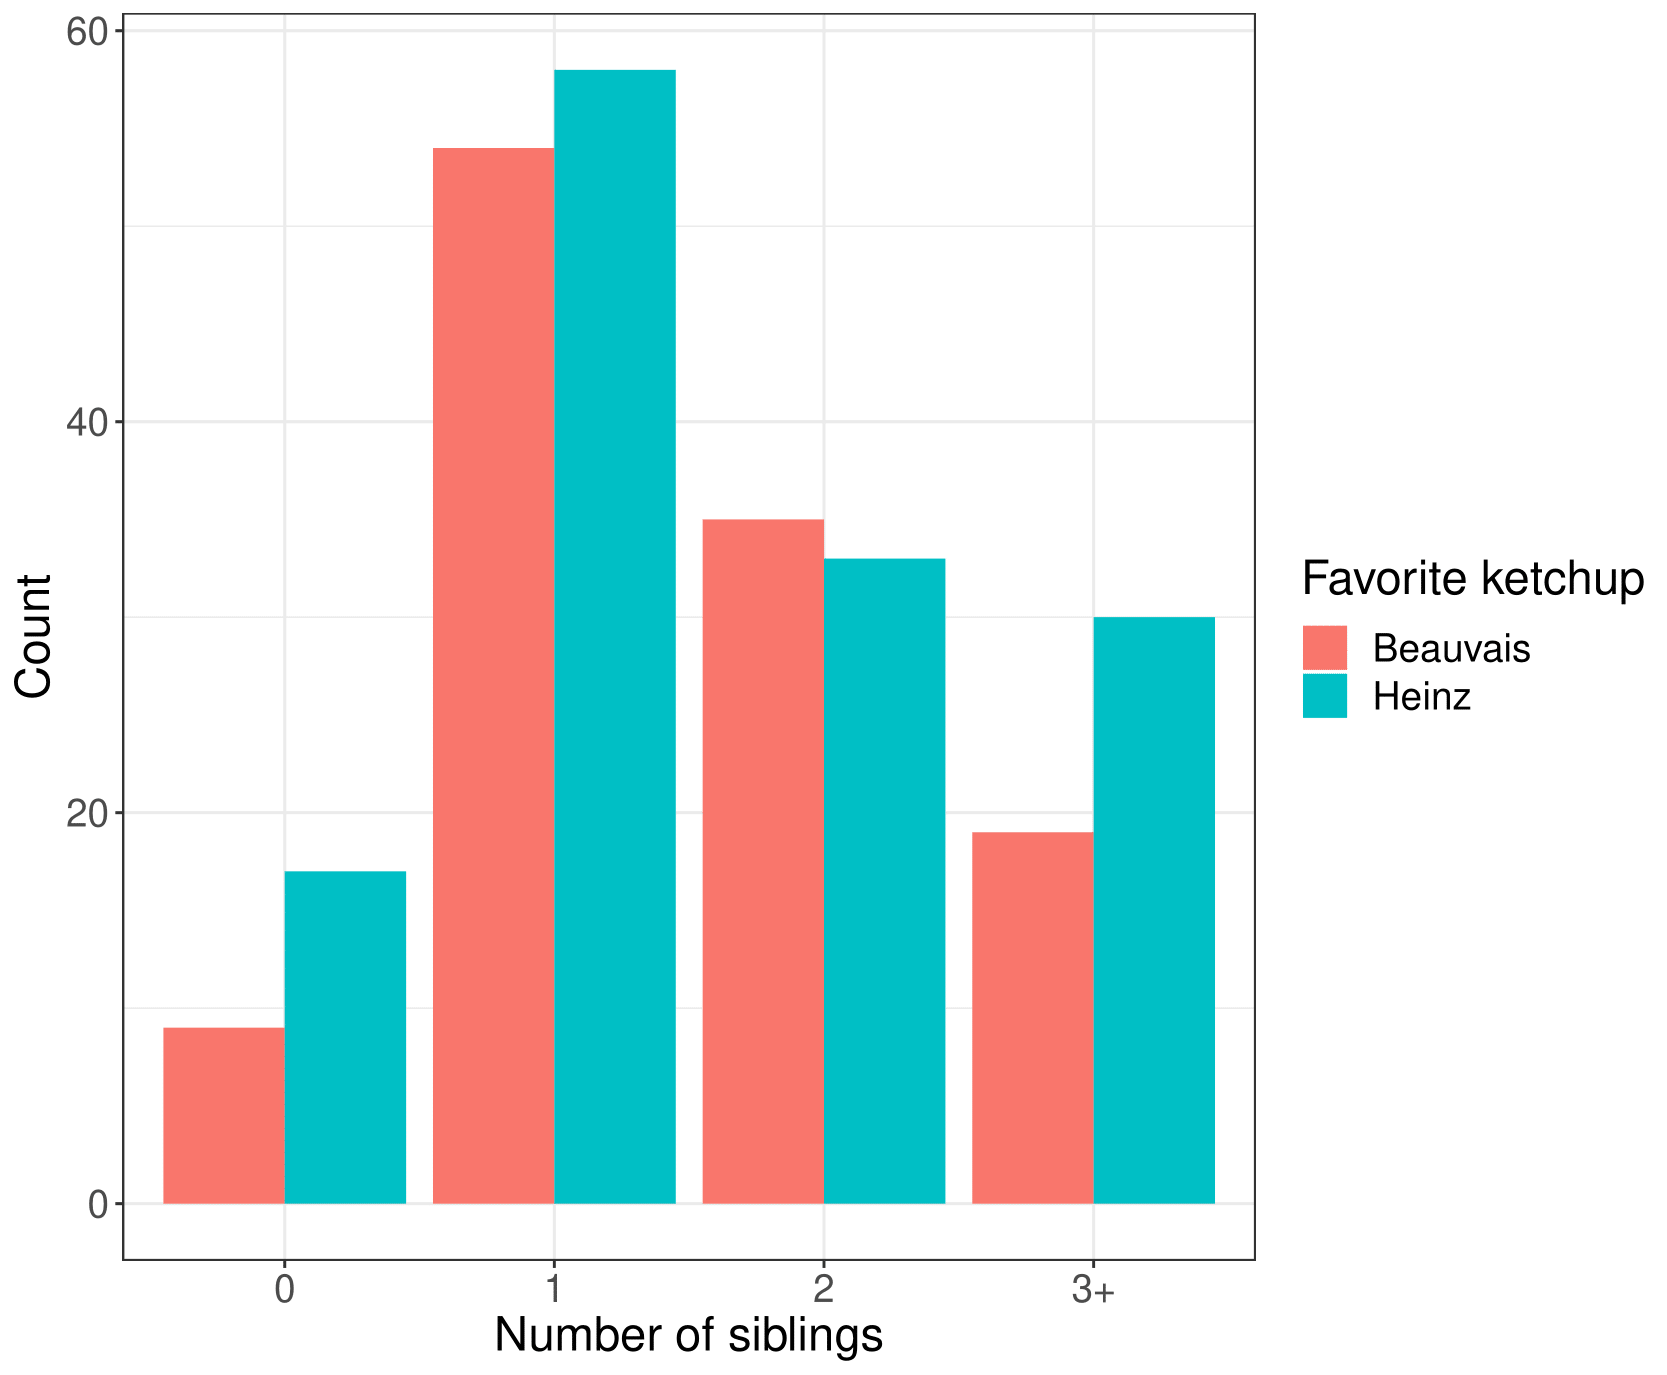
\(10.1\%\) had no siblings, \(44.4\%\) had one sibling, \(26.2\%\) had 2 siblings, and \(19.4\%\) had three or more siblings.
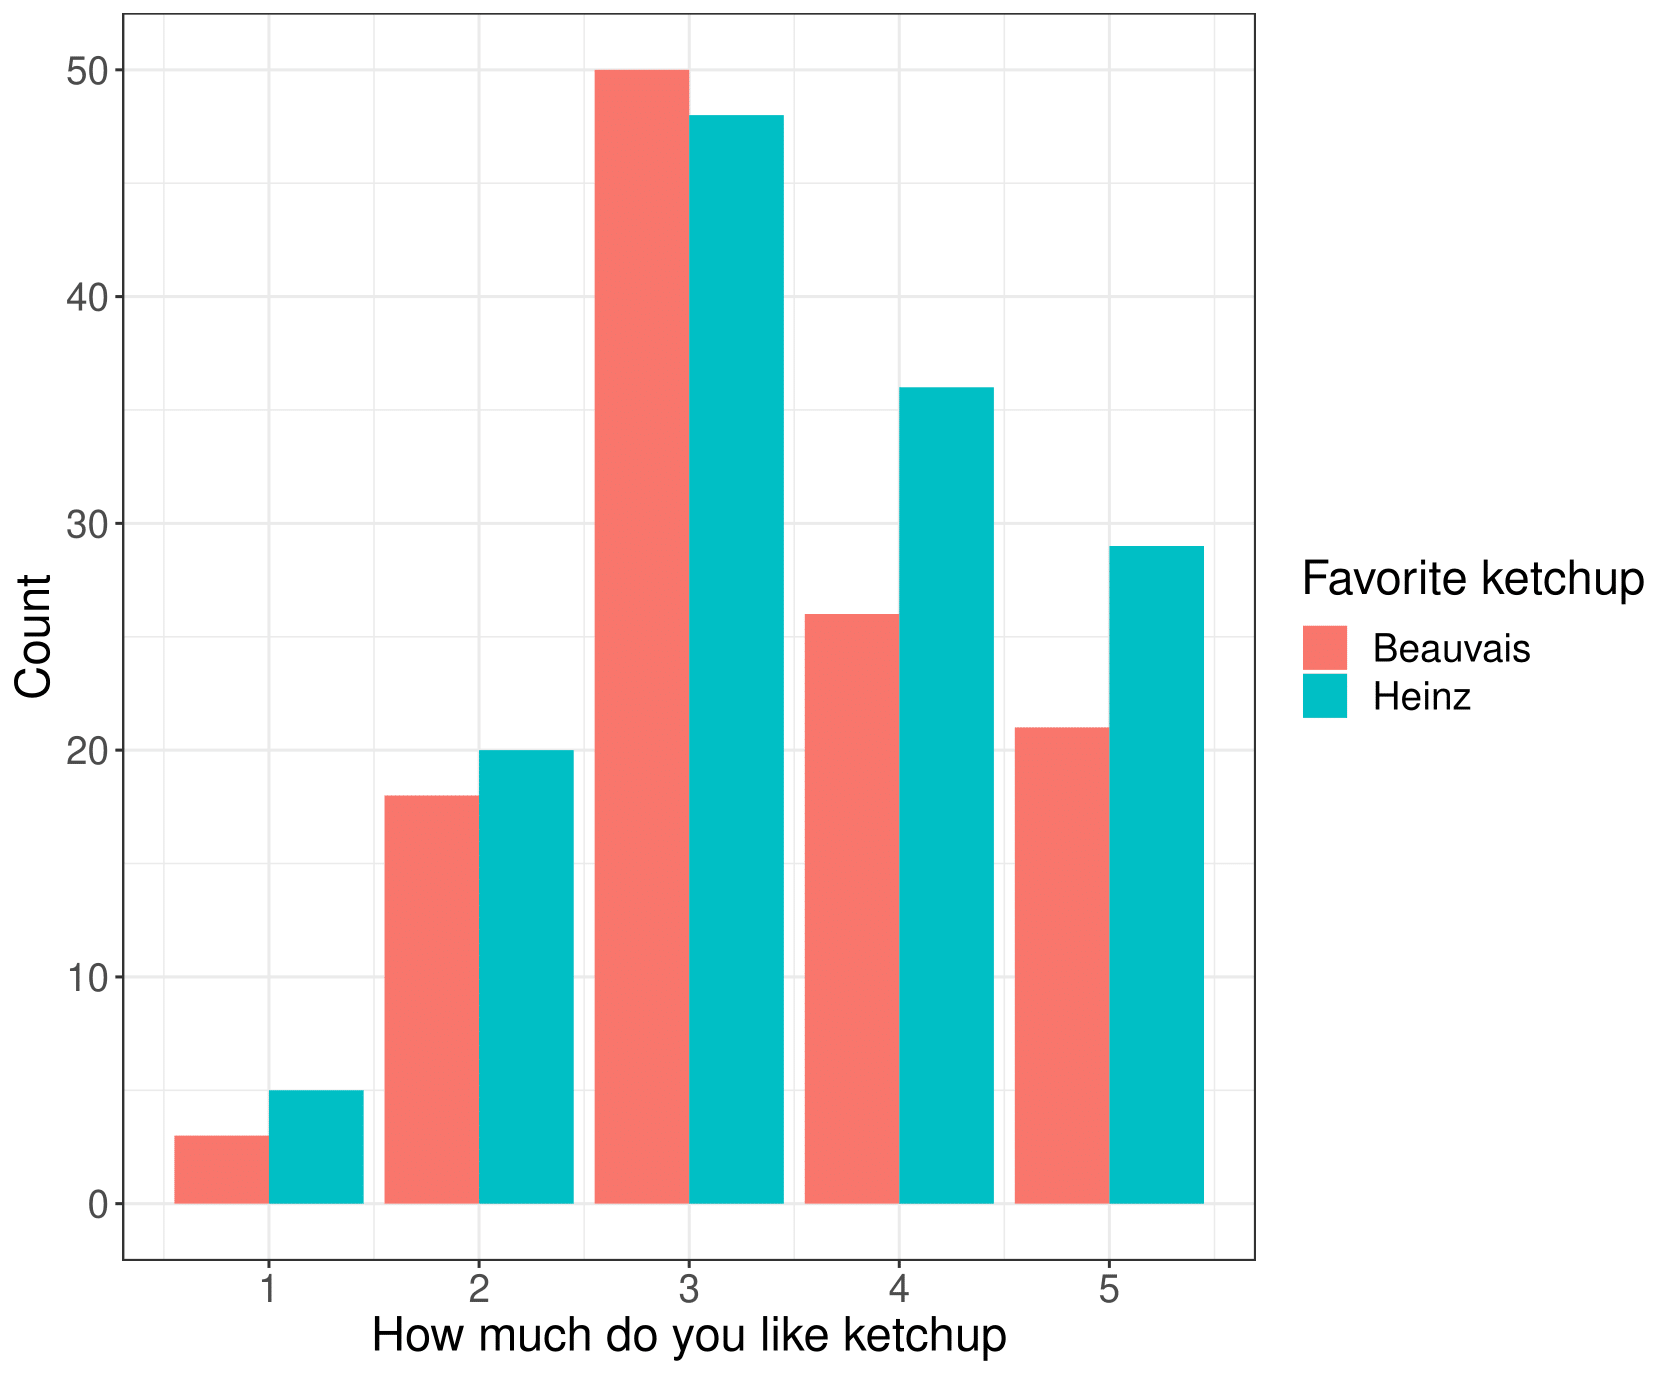
The participants had a median ketchup-liking value of \(3\) with an interquartile range of \(3\) to \(4\).
\(54.3\%\) reported a preference for Heinz.
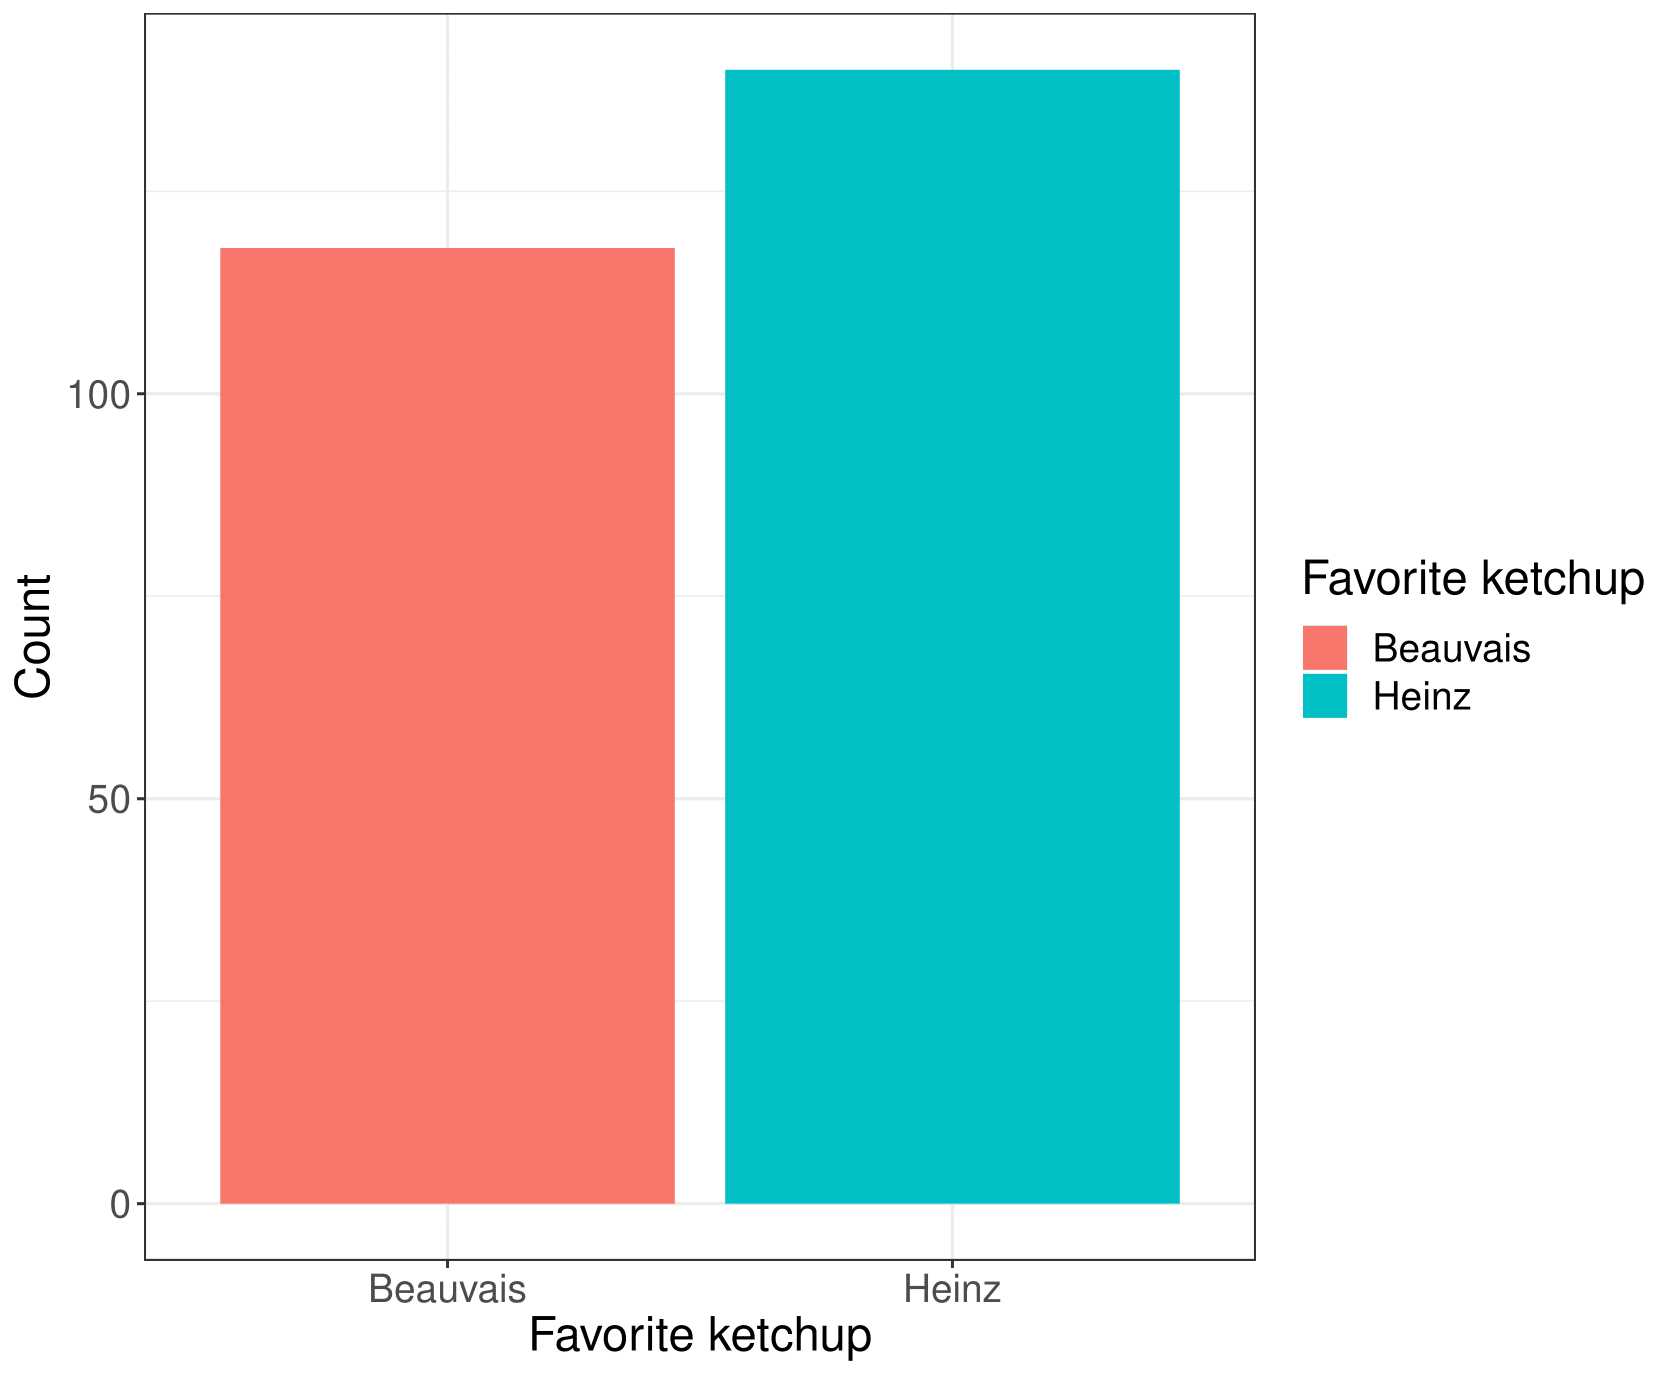
Before any Heinz-fans start running victory laps, we should note that a statistical test for the null hypothesis that the two ketchup’s are equally popular gives a p-value of \(0.31\). Hence, there is no clear marginal winner. If we use this information for a power calculation, we can conclude that we would need \(525\) participants next time to rule out the null on a 5 percent significance level.
Also, that was just the marginal analysis. So how about when we stratify on other question answers? Taking a look at the figures from these comparisons, shown on the figures, we see indications that people brought up outside of Denmark, meat-eaters, people who have none or many siblings, people who go to bed in the time interval 22-01 on a typical Friday night, people with other favorite sports than football and handball, and people who love or hate ketchup all have higher tendencies to favor Heinz, when considering the questions one by one. On the other hand, people who favor dogs, people who clock in early on a Friday night, people with one or two siblings, people who eat meat, people who neither like nor dislike ketchup, and people who favor football tend more to favour Beauvais, when the questions are considered one by one. It is noteworthy, that we do not find that people from Denmark outside of Sealand tend more to favour Beauvais than people from Sealand, as this is contrary to popular belief. You could raise the criticism that we do not have proper representation of non-Copenhagen areas in this study, as the data collection took place in Copenhagen. Or, maybe the reason they moved away from Jutland was their unusual preference for Heinz ketchup - who knows? In any case, selection bias cannot be ruled out.
We also fit a main effects logistic regression for the probability of preferring Heinz over Beauvais, where the results are seen to be overall in line with what was seen on the previous question-by-question figures. In this model we have reparametrized the ketchup-liking variable to be the absolute distance from the middle level 3. Based on this model we may carry out predictions of ketchup-favoritism. So let’s now consider some examples of extreme cases of who is more likely to prefer each of the brands (based on the model of course).
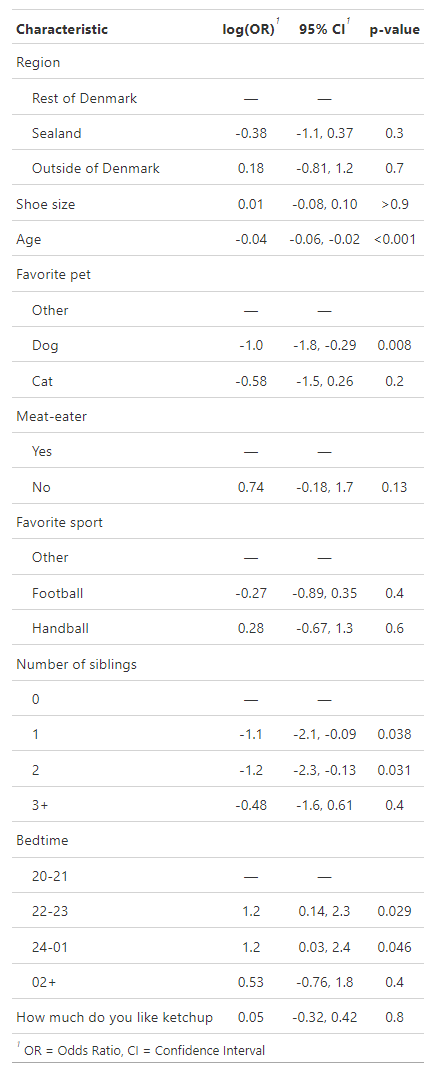
Beauvais person: A person most likely to prefer Beauvais could be (with a predicted probability of \(0.946\)) a Sealander with shoe size 37, who is 60 years of age, whose favorite pet is a dog, who eats meat, who likes football, who has two siblings, who goes to bed at 20-21 on a Friday night, and who either hates or loves ketchup.
Heinz person: A person most likely to prefer Heinz could be (with a predicted probability of \(0.978\)) a person from abroad with shoe-size 45, who is 20 years of age, whose favorite pet is not cat or dog, who does not eat meat, who likes handball, who has no siblings, who goes to bed at 22-23 on a Friday night, and neither likes nor dislikes ketchup.
Looking at these archetypes, we are left with another question, does there actually exists a person from abroad whose favorite sport is handball? The answer is that there is at least no such person in this data, and so these two archetypes may be well outside the support of our sample.
Last words
This concludes our dive into the question of which ketchup label is actually preferred in Denmark between Beauvais and Heinz. Did we make progress? I am not sure. I will leave that up to you.
Before I head off into the storm and leave you to do the same, I will show some additional figures of comparisons between other pairs of variables in the data (not concerning ketchup).